The following graph shows the marginal revenue (MR) and marginal cost (MC) curves of an imperfectly competitive firm. Figure 22.2 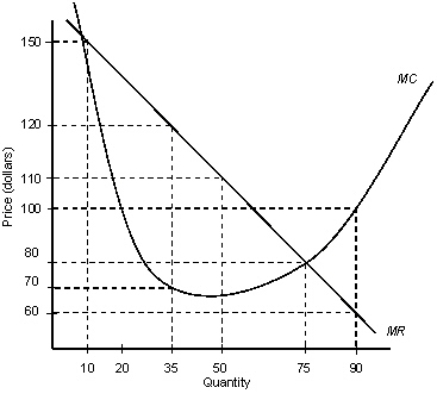 Refer to Figure 22.2.At a quantity of 10 the firm should _____ , but at a quantity of 75 the firm should _____.
Definitions:
Unlevered Cost of Capital
The cost of capital for a company that has no debt, representing the risk of a firm's assets before the impact of financial leverage.
Financial Leverage
Use of borrowed funds to increase the potential return of an investment, also indicating how much a company relies on debt to finance its assets.
Static Theory of Capital Structure
A financial hypothesis that suggests there is an optimal capital structure for a company where the cost of capital is minimized, and the value of the firm is maximized.
M&M Proposition I
A theorem stating that in a perfect market, the market value of a company is unaffected by how that company is financed, regardless of whether through debt or equity.
Q16: According to economists, which of the following
Q20: The figure given below shows the cost
Q34: Which of the following is most likely
Q67: Monopolistic competition is similar to perfect competition
Q69: Currency speculators are traders who seek to
Q71: Monopolization is a process by which the
Q75: The following figure shows the revenue and
Q77: When the exchange rate moves from $1
Q100: The greater the differentiation among products of
Q121: The figure given below depicts the foreign