The figure given below depicts the demand and supply of Brazilian reals in the foreign exchange market.Assume that the market operates under a flexible exchange rate regime. Figure 22.1 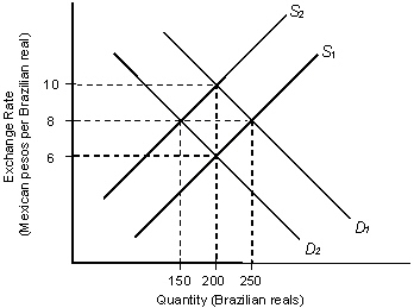 In the figure:
D1 and D2: Demand for Brazilian reals
S1 and S2: Supply of Brazilian reals
Refer to Figure 22.1.Suppose the initial equilibrium exchange rate is 10 pesos per real.A decrease in the Mexican demand for Brazilian coffee, other things equal, is most likely to result in a new equilibrium exchange rate of:
Definitions:
Quota Rent
The earnings exceeding the normal anticipated returns due to import or export quotas.
Deadweight Loss
A decrease in economic effectiveness occurring when a good or service doesn't reach its free market equilibrium.
Minimum Wage
The lowest legal hourly rate of pay that employers can compensate workers, established to protect employees from exploitation.
Equilibrium Price
The price point in the market at which the supply of goods matches the demand for those goods.
Q27: Oligopoly can arise from:<br>A)diseconomies of scale in
Q39: The figure given below shows cost curves
Q43: In the short run when output is
Q58: Suppose the official gold value of the
Q64: The figure given below shows cost curves
Q82: The table given below shows the average
Q100: The greater the differentiation among products of
Q102: The limits of the terms of trade
Q111: Suppose that Megabucks Corporation is earning economic
Q118: If a firm has a perfectly elastic