Multiple Choice
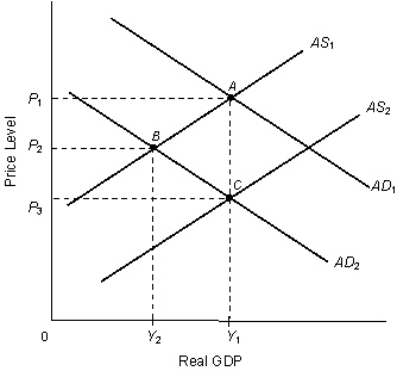
The figure given below depicts the long run equilibrium in an economy. Figure 14.1  In the figure:
AD1 and AD2: Aggregate demand curves
AS1 and AS2: Aggregate supply curves
Refer to Figure 14.1.Movement from point A to point C is equivalent to:
Definitions:
Related Questions
Q20: Hyperinflation in developing countries is typically the
Q21: When negative externalities exist in a market,
Q22: The figure given below shows the demand
Q43: Which of the following stands true for
Q48: Other things equal, an increase in the
Q70: If the government is successful in internalizing
Q74: As a standard of deferred payment, money
Q75: The figure given below shows the income-leisure
Q98: The following table shows the marginal revenue
Q123: Perishable goods such as tomatoes and milk