In the following figure, the first panel shows a market situation prior to regulation and the second panel shows the effects of regulation. Figure 12.2 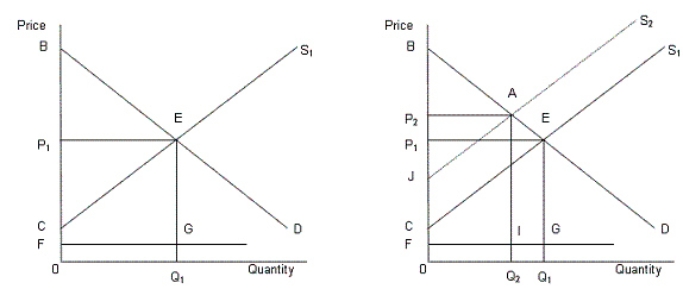 In the figure,
D: Demand curve for automobiles
S1: Supply curve of automobiles prior to regulation
S2: Supply curve of automobiles after regulation
FG: Clean up cost per unit
Refer to Figure 12.2.The regulation will benefit the society if:
Definitions:
Contribution Margin
The revenue remaining after deducting variable costs, which contributes to covering fixed costs and generating profit.
Direct Manufacturing Cost
Expenses directly associated with the production of goods, including direct materials and direct labor costs.
Indirect Manufacturing Cost
Costs related to production that are not directly tied to a specific product, such as maintenance, supervision, and utilities.
Incremental Manufacturing Cost
The additional cost incurred for the manufacturing of one more unit of a product.
Q34: Transfer payments that use income to establish
Q36: Scenario 10.1 Imagine an economy that does
Q53: Which of the following refers to a
Q60: For years, Intel was able to charge
Q65: The concept of double coincidence of wants
Q74: Which of the following is an example
Q94: Which of the following is most likely
Q106: If the Fed follows a high-growth monetary
Q108: Assume that the multiplier effect for Mexico
Q110: In the context of market structure, the