In the following figure, the first panel shows a market situation prior to regulation and the second panel shows the effects of regulation. Figure 12.2 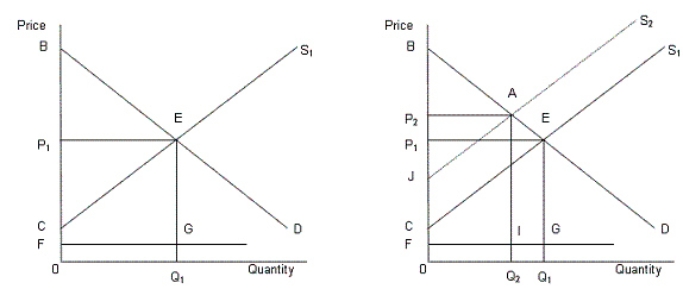 In the figure,
D: Demand curve for automobiles
S1: Supply curve of automobiles prior to regulation
S2: Supply curve of automobiles after regulation
FG: Clean up cost per unit
Refer to Figure 12.2.The regulation will benefit the society if:
Definitions:
Visualization
The process of forming a mental image of something, often used as a technique in planning or creative endeavors.
Imagining
The process of creating mental images or scenarios that are not currently present to the senses, used in creativity, problem-solving, and planning.
Disinhibition
The reduction of inhibition, resulting in spontaneous behavior without consideration for societal norms or potential risks.
Inhibition
The process of restraining or suppressing a behavior, emotion, or impulse.
Q7: If the U.S.dollar depreciates against the yen
Q24: Identify the correct statement.<br>A)It is absolutely compulsory
Q28: According to economists, the fixed-price model of
Q29: The free rider problem arises when a
Q37: The table given below shows the prices
Q38: The following figure shows the revenue and
Q49: The figure given below shows the demand
Q63: A market is said to be concentrated
Q70: The figures given below represent the revenue
Q119: _ are accounts at the U.S.commercial banks