The figure given below shows the demand curves of two classes of buyers for tickets to a football match. Figure 10.4 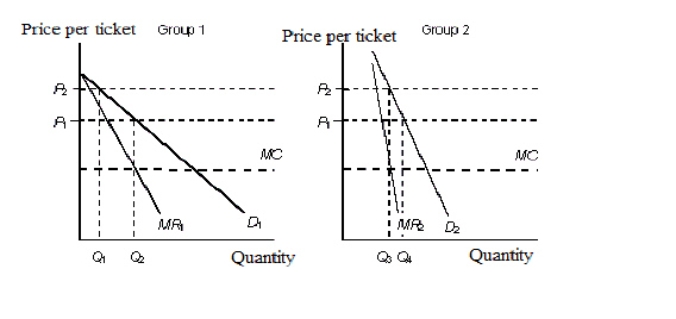 D1: Demand curve of group 1
D2: Demand curve of group 2
MR1: Marginal revenue of group 1
MR2: Marginal revenue of group 2
MC: Marginal cost
In Figure 10.4, the demand curve D2:
Definitions:
Volume of Activity
A measure of the quantity of work performed or the level of operations, often used to allocate overhead costs in activity-based costing.
Indirect Costs
Indirect costs are expenses that are not directly tied to a specific project, product, or activity, often including overhead costs like administration, facilities, and security.
Cost Object
An item for which costs are compiled or measured, such as a product, service, or department.
Customer Orientation
A business approach that prioritizes identifying and meeting the needs and expectations of customers.
Q1: The figure given below shows the demand
Q8: In the table given below Y represent
Q12: Suppose that Mr.Chopp withdraws $500 from his
Q49: Cities and local governments in the United
Q69: The Gulf Cartel and Sinaloa Cartel are
Q69: The table given below shows the levels
Q102: If a monopolist is producing at a
Q103: The primary international reserves in most countries
Q104: Both monopolistically and perfectly competitive firms earn
Q110: Since the beginning of the millennium, the