The figure given below shows the demand curves of two classes of buyers for tickets to a football match. Figure 10.4 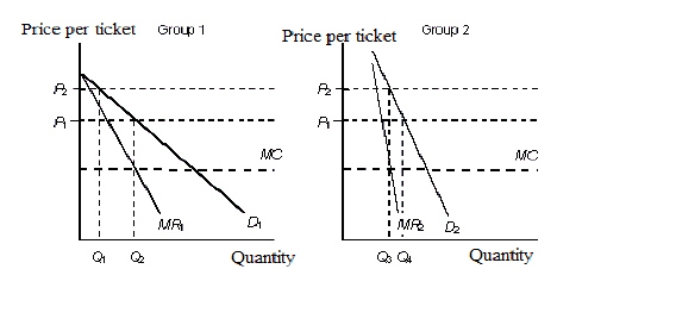 D1: Demand curve of group 1
D2: Demand curve of group 2
MR1: Marginal revenue of group 1
MR2: Marginal revenue of group 2
MC: Marginal cost
Refer to Figure 10.4.What price must be charged to both the groups to maximize profits?
Definitions:
Price Stability
A situation in an economy where prices in general do not change significantly over time, minimizing uncertainty and conducive to economic growth.
Oligopolies
Market structures characterized by a small number of firms that have significant market power, which can influence prices and output levels.
Cartels
Formal agreements among competing firms to control prices, production, and distribution of goods, often to restrict competition and increase profits illegally.
Collusive Arrangements
Agreements between firms to control prices or exclude entry of a new competitor in the market, often in violation of antitrust laws.
Q4: The following graph shows the marginal revenue
Q11: In monopolistic competition, firms may differentiate their
Q18: Money fails to act as a store
Q29: The figures given below represent the revenue
Q30: The table given below reports the consumption
Q33: In the table given below Y represent
Q36: Government spending equals the sum of _,
Q41: The monopolistically competitive firm will charge a
Q86: Once macroeconomic equilibrium has been established in
Q90: The 45-degree line used in a consumption