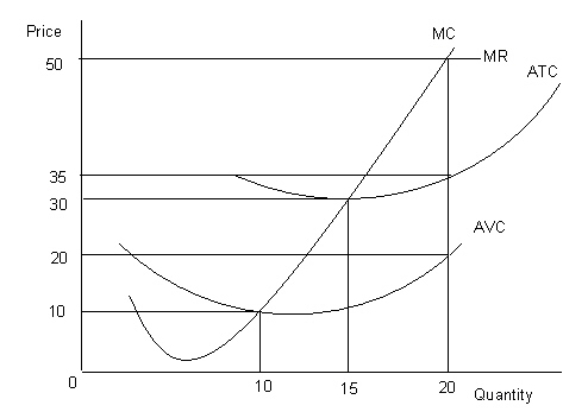
The figure given below shows the revenue and cost curves of a perfectly competitive firm. Figure 9.2  MC: Marginal cost curve
MR: Marginal revenue curve
ATC: Average-total-cost curve
AVC: Average-variable-cost curve
Refer to Figure 9.2.Compute the profit earned by the firm at the profit-maximizing level of output.
Definitions:
Q4: The following graph shows the marginal revenue
Q14: Monopolistic competition is similar to perfect competition
Q15: What would be the impact of an
Q27: In contrast to perfect competition, in a
Q30: The figure given below shows the revenue
Q63: In the table given below Y represent
Q95: The figure given below shows the macroeconomic
Q96: Other things equal, when Europeans want to
Q96: The table given below shows the prices
Q122: Identify the characteristics of a monopoly firm.<br>A)Barred