Multiple Choice
Exhibit 12-3
Regression analysis was applied between sales data (in $1,000s) and advertising data (in $100s) and the following information was obtained.
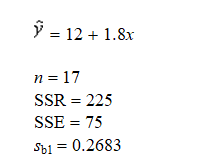
-Refer to Exhibit 12-3. The F statistic computed from the above data is
Recognize the impact of sexism and teacher expectations on student achievement and classroom dynamics.
Identify cognitive distortions and attribution styles associated with depression.
Comprehend the diversity of factors contributing to school refusal and its relationship with anxiety disorders.
Understand the characteristics, causes, and treatment of conduct disorder.
Definitions:
Related Questions
Q13: Which of the following statements about the
Q15: In acceptance sampling, the risk of accepting
Q44: Juran proposed a simple definition of quality:<br>A)customer
Q48: Refer to Exhibit 10-15. If at 95%
Q74: Refer to Exhibit 11-5. At 95% confidence,
Q74: In multiple regression analysis, the correlation among
Q78: A national poll reported that 58% of
Q85: Three universities in your state decided to
Q152: Regional Manager Sue Collins would like to
Q184: Refer to Exhibit 10-16. The mean square