Use the figure for the question(s) below. 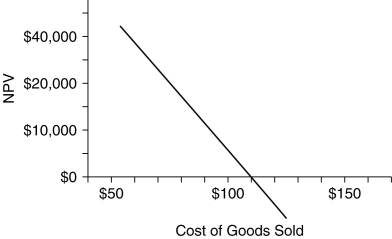
-The graph above shows the break-even analysis for the cost of making a certain good. Based on this chart, which of the following is true?
Definitions:
Managers
Individuals responsible for directing, controlling, and administering all or part of a company or similar organization.
Revenue Maximization
The strategy of adjusting prices or sales volume to generate the highest possible income from sales, not necessarily coinciding with maximum profit.
Takeover Targets
Companies that are potential candidates for acquisition by other companies due to their attractive attributes or undervalued assets.
Profit-Maximizing Firms
Businesses that operate with the objective to produce the quantity of output that maximizes the difference between total revenue and total cost.
Q7: If you value a stock using a
Q8: Which of the following statements is FALSE?<br>A)
Q13: A portfolio comprises Coke (beta of 1.4)
Q25: The table above shows the stock prices
Q35: How do the growth perpetuity results differ
Q37: Consider the following timeline detailing a stream
Q47: The risk premium of a stock is
Q77: The only cash payment an investor in
Q79: Historically, why were high inflation rates associated
Q118: What are some potential problems in using