Multiple Choice
The graph below shows how yield in two varieties of corn respond to different environmental conditions.Which statement below is TRUE? 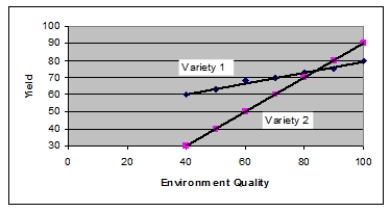
Definitions:
Related Questions
Q11: Explain the genetic basis for sterility in
Q15: Which type of chromosome mutation increases the
Q17: Insertion or removal of one or more
Q23: _ is BEST known for developing the
Q31: How many introns are present on a
Q38: In animals, what is a diploid cell
Q53: Suppose a research study shows that people
Q56: What evidence is there that viruses evolved
Q56: Upon transposing to a new site, transposable
Q103: You observe continuous variation in tail length