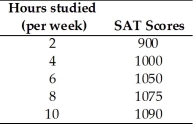
-Jamie is preparing to take his SAT tests.The table above shows how Jamie's score depends on the number of hours a week Jamie studies
a.Plot the relationship in the figure,putting the hours studied on the horizontal axis.

b.Is the relationship you plotted positive or negative?
c.What happens to the slope of the relationship as hours studied increase?
d.Suppose Jamie can enroll in an SAT prep course and,by so doing,for every possible number of hours he studies,his score will be 100 points higher.Plot the new relationship between the number of hours studied and Jamie's SAT score in the figure.
e.How many variables are involved in the figure you just completed?
Definitions:
Dark Social
Web traffic that is not tracked by conventional analytics tools, often shared through private communication channels such as emails and messaging apps.
Web Traffic
Refers to the amount of data sent and received by visitors to a website, a measure of its popularity and engagement.
Web Analytics
Web analytics involves the collection, analysis, and reporting of web data to understand and optimize web usage, helping website owners to improve visitor experience and achieve digital marketing objectives.
Antipsychotic Medication
Drugs used to manage psychosis, including delusions, hallucinations, or disorders such as schizophrenia.
Q9: The textbook suggests that the receiver of
Q17: Which of the following is generally true
Q22: The characteristic from which all economic problems
Q80: The figure above shows how the sales
Q97: Which of the following is a macroeconomic
Q132: The slope of the line shown in
Q176: An export good is a good produced<br>A)
Q243: To graph a relationship among several variables,we
Q298: What is the difference between a positive
Q342: A time-series graph measures<br>A) the value of