The following Excel scatterplot with the fitted quadratic regression equation illustrates the observed relationship between productivity and the number of hired workers. 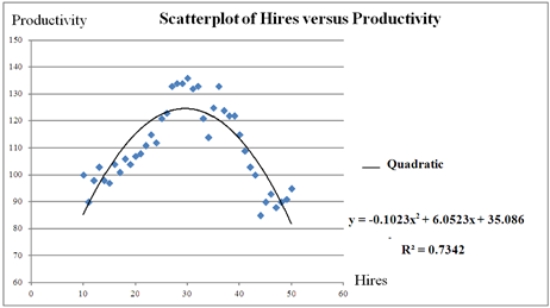 What is the percentage of variations in the productivity explained by the number of hired workers?
Definitions:
Q42: Unlike the coefficient of determination,the coefficient of
Q45: One-way ANOVA analyzes the effect of one
Q50: The following table includes the information about
Q50: To examine the differences between salaries of
Q52: For the model y = β<sub>0 </sub>+
Q55: When some explanatory variables of a regression
Q60: A researcher analyzes the factors that may
Q69: Which of the following represents a logistic
Q84: For the model y = β<sub>0 </sub>+
Q88: The Kruskal-Wallis test is the nonparametric alternative