A researcher studies the relationship between SAT scores,the test-taker's family income,and his or her grade point average (GPA) .Data are collected from 24 students.He estimates the following model:SAT = β0 + β1 GPA + β2 Income + ε.The following table summarizes a portion of the regression results. 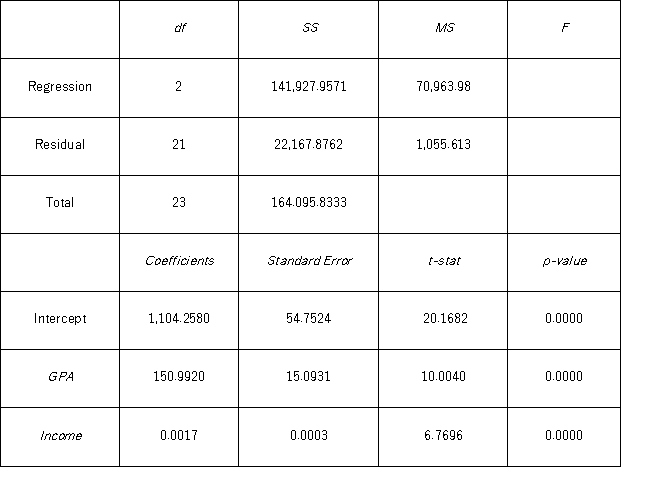 Which of the following is the value of the test statistic for testing the joint significance of the linear regression model?
Definitions:
Q7: A sociologist examines the relationship between the
Q9: To examine the differences between salaries of
Q11: The scatterplot shown below represents a typical
Q12: Consider the following table providing the prices
Q27: In the following table,likely voters' preferences of
Q47: The linear and logarithmic models,y = β<sub>0</sub>
Q65: The following table shows the distribution of
Q76: When testing r linear restrictions imposed on
Q101: A card-dealing machine deals spades (1),hearts (2),clubs
Q104: In the following table,likely voters' preferences of