The following table shows the observed frequencies of the amount of assets under management for a sample of 134 hedge funds.The table also contains the hypothesized proportion of each class assuming the amount of assets under management has a normal distribution.The sample mean and standard deviation are 15 billion and 11 billion respectively. 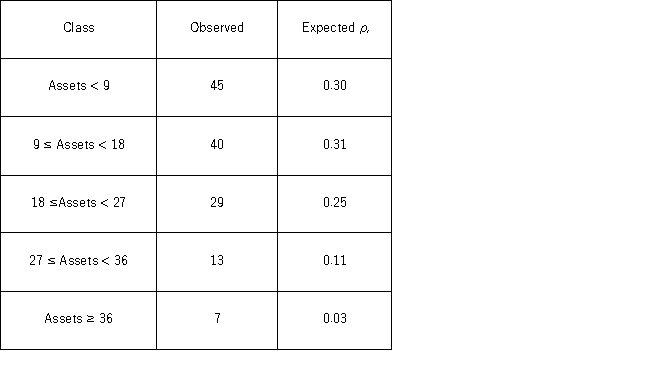 a.Set up the competing hypotheses for the goodness-of-fit test of normality for amount of assets under management.
b.Calculate the value of the test statistic and determine the degrees of freedom.
c.Specify the critical value at the 5% significance level.
d.Is there evidence to suggest the amount of assets under management do not have a normal distribution?
e.Are there any conditions that may not be satisfied?
Definitions:
Agricultural Production
The process and outcome of cultivating crops and livestock for human use and consumption.
Interest Rate
The percentage of a sum of money charged for its use, often expressed as an annual percentage.
Say's Law
A principle attributed to French economist Jean-Baptiste Say, suggesting that supply creates its own demand, meaning production inherently generates the demand for goods and services.
Consumption
The action or process of using goods and services for personal needs or desires, typically considered as a component of GDP.
Q2: In general,the null and alternative hypotheses are
Q5: Suppose Bank of America would like to
Q16: When estimating <img src="https://d2lvgg3v3hfg70.cloudfront.net/TB4266/.jpg" alt="When estimating
Q25: When testing whether the correlation coefficient differs
Q26: When conducting a hypothesis test concerning the
Q31: The accompanying table shows the regression results
Q32: Packaged candies have three different types of
Q51: A career counselor wants to understand if
Q55: Suppose Bank of America would like to
Q58: The following data for five years of