Suppose Bank of America would like to investigate if the credit score and income level of an individual are independent of one another.Bank of America selected a random sample of 400 adults and asked them to report their credit score range and their income range.The following contingency table presents these results. 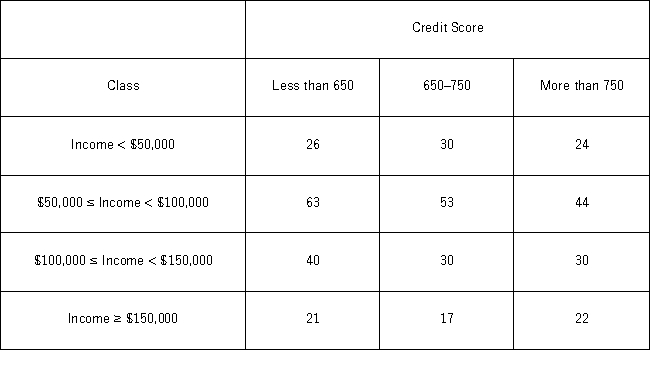 The expected number of individuals with income less than $50,000 and a credit score between 650 and 750 is ______.
Definitions:
Planned Shopping Center
A group of architecturally unique business establishments on a site that is centrally owned or managed.
Big Data Analytics
The process of examining large and varied data sets, or big data, to uncover hidden patterns, correlations, market trends, and customer preferences.
Merchandise
Goods that are available for sale in retail or wholesale.
Off-price Retailers
Retail stores that sell high-quality goods at lower prices than traditional retail prices, often through the purchase of overstock items or direct negotiations.
Q8: Which of the following is the correct
Q10: When testing the difference between two population
Q15: A real estate investor thinks the real
Q16: A demographer wants to measure life expectancy
Q29: The national average for an eighth-grade reading
Q36: A marketing manager examines the relationship between
Q65: If s<sup>2</sup> is computed from a random
Q70: The heights (in cm)for a random sample
Q71: The minimum sample size n required to
Q109: We always deal with matched-pairs sampling if