The following frequency distribution shows the monthly stock returns for Home Depot for the years 2003 through 2007. 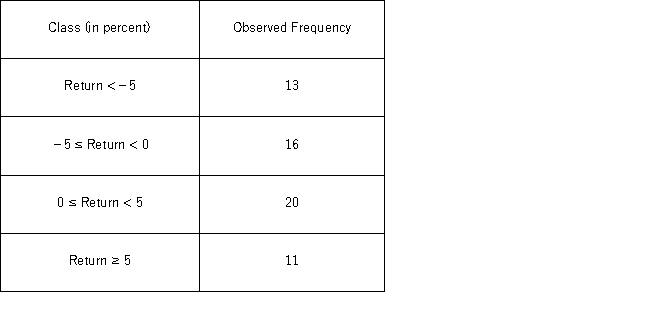 Over the time period,the following summary statistics are provided: Mean = 0.31%,Standard deviation = 6.49%,Skewness = 0.15,and Kurtosis = 0.38.The test statistic for the Jarque-Bera test for normality is ______.
Definitions:
Product Technology
The incorporation of technological advancements into the development and improvement of a product.
Innovation Process
A systematic approach to creating new ideas, products, or methods, typically involving stages such as ideation, development, and implementation.
Service Economy
An economy or sector characterized by the dominance of services over goods, including industries such as retail, healthcare, and information technology.
Jobs
Positions of employment where individuals perform specific tasks or duties in exchange for compensation.
Q13: Costco sells paperback books in their retail
Q26: When conducting a hypothesis test concerning the
Q30: Consider the following data: <img src="https://d2lvgg3v3hfg70.cloudfront.net/TB4266/.jpg" alt="Consider
Q31: In the test for comparing two population
Q39: Which of the following nonlinear regression models
Q80: Suppose you want to determine if the
Q81: Typically,the sales volume declines with an increase
Q99: Which of the following is a typical
Q123: Suppose we wish to find the required
Q132: A hypothesis test regarding the population mean