The following frequency distribution shows the monthly stock returns for Home Depot for the years 2003 through 2007. 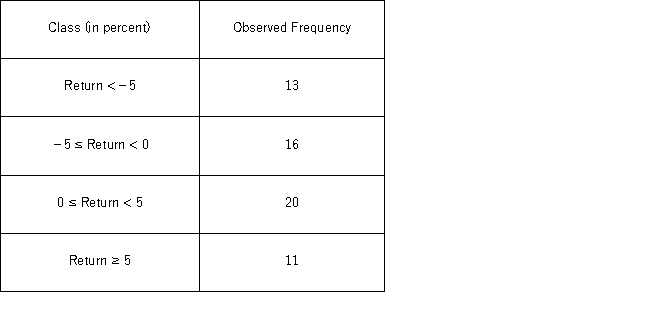 Over the time period,the following summary statistics are provided: Mean = 0.31%,Standard deviation = 6.49%,Skewness = 0.15,and Kurtosis = 0.38.Using the Jarque-Bera test for normality,the p-value is __________.
Definitions:
Q4: Professors of accountancy are in high demand
Q10: Psychology students want to determine if there
Q18: Assume you ran a multiple regression to
Q25: AutoTrader.com would like to test if a
Q30: In a multiple regression based on 30
Q41: For the chi-square test for normality,the expected
Q63: For the goodness-of-fit test for normality to
Q81: A fund manager wants to know if
Q81: Typically,the sales volume declines with an increase
Q132: A statistics student is asked to estimate