The following table shows the observed frequencies of the quarterly returns for a sample of 60 hedge funds.The table also contains the hypothesized proportions of each class assuming the quarterly returns have a normal distribution.The sample mean and standard deviation are 3.6% and 7.4% respectively. 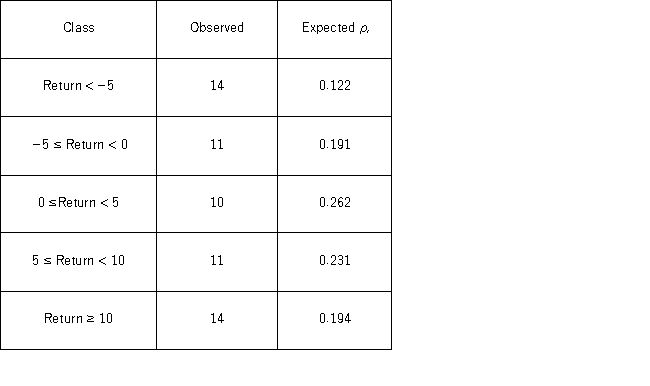 a.Set up the competing hypotheses for the goodness-of-fit test of normality for the quarterly returns.
b.Calculate the value of the test statistic and determine the degrees of freedom.
c.Compute the p-value.Does the evidence suggest that the quarterly returns do not have a normal distribution at the 10% significance level?
Definitions:
Different First Page
A feature in word processing software that allows the first page of a document to have a different header or footer than the rest of the pages.
Format Page Numbers
The process of customizing the appearance and sequence of page numbers in a document.
Draw Table
A feature in word processing and presentation software that allows users to create a table grid by clicking and dragging with the mouse.
Resize Width
Adjusting the width of elements such as columns in spreadsheets or graphical objects in a digital environment.
Q3: A new sales training program has been
Q5: A new study has found that,on average,6-
Q12: The confidence intervals for the population proportion
Q19: In the estimation of a multiple regression
Q34: The choice of an appropriate test for
Q34: Simple linear regression analysis differs from multiple
Q46: The airline industry defines "no-shows" as passengers
Q99: The following table shows the distribution of
Q105: Which of the following is the value
Q116: The hypothesis statement H: <img src="https://d2lvgg3v3hfg70.cloudfront.net/TB4266/.jpg" alt="The