The figure shows is a plot and a fitted linear regression line of the age-earnings profile of 1,744 individuals,taken from the Current Population Survey. 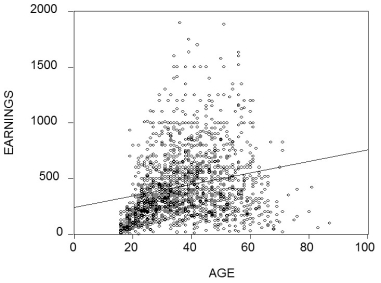 (a)Describe the problems in predicting earnings using the fitted line.What would the pattern of the residuals look like for the age category under 40?
(b)What alternative functional form might fit the data better?
(c)What other variables might you want to consider in specifying the determinants of earnings?
Definitions:
Q2: A PO is a security promising a
Q7: The GLS assumptions include all of the
Q23: Your textbook has analyzed simultaneous equation systems
Q24: Currency swaps can result in savings for
Q36: Give at least three examples from economics
Q41: Assume that the data looks as follows:<br>Y
Q43: Based on the price sensitivity hedge ratio,if
Q47: The population multiple regression model when there
Q55: What is the minimum value of the
Q56: Suppose you buy an asset at $70