In a Monte Carlo study,econometricians generate multiple sample regression functions from a known population regression function.For example,the population regression function could be Yi = β0 + β1Xi = 100 - 0.5 Xi.The Xs could be generated randomly or,for simplicity,be nonrandom ("fixed over repeated samples").If we had ten of these Xs,say,and generated twenty Ys,we would obviously always have all observations on a straight line,and the least squares formulae would always return values of 100 and 0.5 numerically.However,if we added an error term,where the errors would be drawn randomly from a normal distribution,say,then the OLS formulae would give us estimates that differed from the population regression function values.Assume you did just that and recorded the values for the slope and the intercept.Then you did the same experiment again (each one of these is called a "replication").And so forth.After 1,000 replications,you plot the 1,000 intercepts and slopes,and list their summary statistics.
Sample: 1 1000
BETA0_HAT BETA1_HAT
Mean 100.014 -0.500
Median 100.021 -0.500
Maximum 106.348 -0.468
Minimum 93.862 -0.538
Std.Dev.1.994 0.011
Skewness 0.013 -0.042
Kurtosis 3.026 2.986
Jarque-Bera 0.055 0.305
Probability 0.973 0.858
Sum 100014.353 -499.857
Sum Sq.Dev.3972.403 0.118
Observations 1000.000 1000.000
Here are the corresponding graphs: 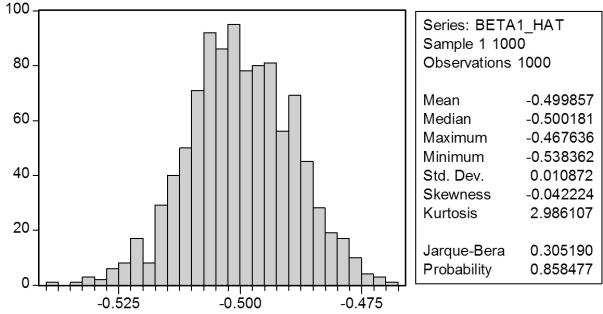
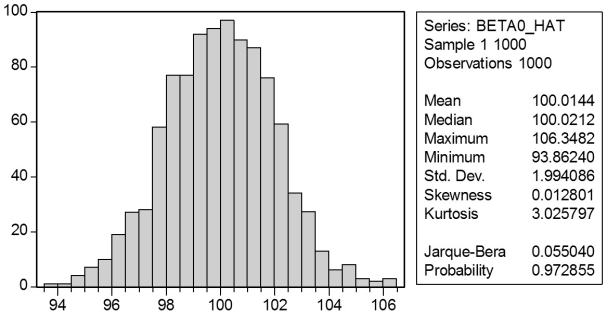 Using the means listed next to the graphs,you see that the averages are not exactly 100 and -0.5.However,they are "close." Test for the difference of these averages from the population values to be statistically significant.
Definitions:
Foot-In-The-Door Phenomenon
The foot-in-the-door phenomenon is a psychological tactic involving getting someone to agree to a small request to increase the chances they will agree to a larger request later.
Role Playing
A method for learning or therapeutic intervention where individuals act out roles in a controlled setting to gain insight into themselves or others.
Fundamental Attribution Error
The tendency for observers to underestimate situational influences and overestimate personal disposition and traits when interpreting others' behavior.
Compassionate Personality
A compassionate personality is characterized by a habitual inclination towards empathy and concern for others, and a desire to help those in suffering.
Q10: Attendance at sports events depends on various
Q14: Unit root tests<br>A)use the standard normal distribution
Q14: All of the following are reasons for
Q15: The law of one price states that
Q31: Currency swap volume is greater than equity
Q39: An investor who expects to purchase stock
Q44: A currency swap with no notional amount
Q47: Simultaneous causality bias<br>A)is also called sample selection
Q50: Using the California School data set from
Q55: The expected value of a discrete random