Probabilities and relative frequencies are related in that the probability of an outcome is the proportion of the time that the outcome occurs in the long run.Hence concepts of joint,marginal,and conditional probability distributions stem from related concepts of frequency distributions.
You are interested in investigating the relationship between the age of heads of households and weekly earnings of households.The accompanying data gives the number of occurrences grouped by age and income.You collect data from 1,744 individuals and think of these individuals as a population that you want to describe,rather than a sample from which you want to infer behavior of a larger population.After sorting the data,you generate the accompanying table:
Joint Absolute Frequencies of Age and Income,1,744 Households
Age of head of household
X1 X2 X3 X4 X5 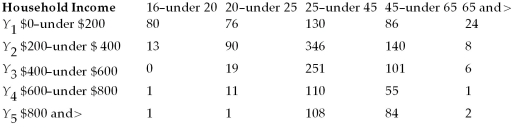 The median of the income group of $800 and above is $1,050.
(a)Calculate the joint relative frequencies and the marginal relative frequencies.Interpret one of each of these.Sketch the cumulative income distribution.
(b)Calculate the conditional relative income frequencies for the two age categories 16-under 20,and 45-under 65.Calculate the mean household income for both age categories.
(c)If household income and age of head of household were independently distributed,what would you expect these two conditional relative income distributions to look like? Are they similar here?
(d)Your textbook has given you a primary definition of independence that does not involve conditional relative frequency distributions.What is that definition? Do you think that age and income are independent here,using this definition?
Definitions:
Variance
A measure of the dispersion or spread within a set of data points, indicating the average of the squared deviations from the mean.
Median
The middle value in a data set, which separates the higher half from the lower half when the numbers are arranged in order.
Mode
Most frequently occurring score or value of a variable in a set of data.
Range
The difference between the highest and lowest values in a data set, indicating the span of data points.
Q2: In the case of heterogeneous causal effects,the
Q5: (Requires Appendix material)When the fifth assumption in
Q9: The neoclassical growth model predicts that for
Q11: Consider the multiple regression model from Chapter
Q19: Imperfect multicollinearity<br>A)is not relevant to the field
Q25: What does the Gauss-Markov theorem prove? Without
Q28: "Heteroskedasticity typically occurs in cross-sections,while serial correlation
Q30: Consider a model with one endogenous regressor
Q40: Failure to follow the treatment protocol means
Q44: Equation (11.3)in your textbook presents the regression