You have collected quarterly Canadian data on the unemployment and the inflation rate from 1962:I to 2001:IV.You want to re-estimate the ADL(3,1)formulation of the Phillips curve using a GARCH(1,1)specification.The results are as follows:  t = 1.17 - .56 ΔInft-1 - .47 ΔInft-2 - .31 ΔInft-3 - .13 Unempt-1
(.48)(.08)(.10)(.09)(.06)  = .86 + .27
  + .53
+ .53  .
.
(.40)(.11)(.15)
(a)Test the two coefficients for  and
and  in the GARCH model individually for statistical significance.
(b)Estimating the same equation by OLS results in  t = 1.19 - .51 ΔInft-1 - .47 ΔInft-2 - .28 ΔInft-3 - .16Unempt-1
(.54)(.10)(.11)(.08)(.07)
Briefly compare the estimates.Which of the two methods do you prefer?
(c)Given your results from the test in (a),what can you say about the variance of the error terms in the Phillips Curve for Canada?
(d)The following figure plots the residuals along with bands of plus or minus one predicted standard deviation (that is,±  )based on the GARCH(1,1)model.
 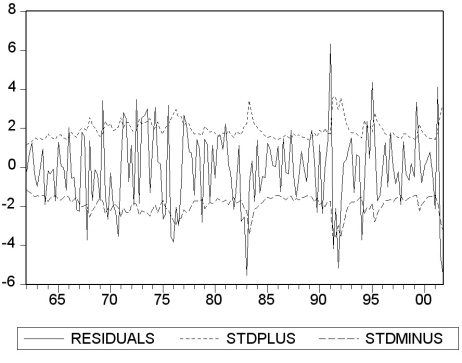 Describe what you see.
Definitions:
Apoptosis
A process of programmed cell death that occurs in multicellular organisms, characterized by cell shrinkage, chromatin condensation, and DNA fragmentation.
Antibody
A blood protein produced in response to and counteracting a specific antigen; antibodies recognize and neutralize foreign substances such as bacteria and viruses.
Antigen
A substance that induces an immune response in the body, especially the production of antibodies.
Epitope
A specific part of an antigen that is recognized and bound by an antibody or a receptor of the immune system.
Q4: Econometrics can be defined as follows with
Q11: Consider the following two models to explain
Q19: Your textbook plots the estimated regression function
Q32: (Requires Chapter 8)When using panel data and
Q35: One implication of the extended least squares
Q35: A simple random sample of 85 students
Q38: A pattern in the coefficients of the
Q45: To analyze the year-to-year variation in temperature
Q46: Your textbook suggests an "entity-demeaned" procedure to
Q49: Adult males are taller,on average,than adult females.Visiting