To analyze the year-to-year variation in temperature data for a given city,you regress the daily high temperature (Temp)for 100 randomly selected days in two consecutive years (1997 and 1998)for Phoenix.The results are (heteroskedastic-robust standard errors in parenthesis):  = 15.63 + 0.80 ×
  ;R2= 0.65,SER = 9.63
(0.10)
(a)Calculate the predicted temperature for the current year if the temperature in the previous year was 40°F,78°F,and 100°F.How does this compare with you prior expectation? Sketch the regression line and compare it to the 45 degree line.What are the implications?
(b)You recall having studied errors-in-variables before.Although the web site you received your data from seems quite reliable in measuring data accurately,what if the temperature contained measurement error in the following sense: for any given day,say January 28,there is a true underlying seasonal temperature (X),but each year there are different temporary weather patterns (v,w)which result in a temperature  different from X.For the two years in your data set,the situation can be described as follows:
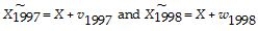
 Hence the population parameter for the intercept and slope are zero and one,as expected.It is not difficult to show that the OLS estimator for the slope is inconsistent,where
 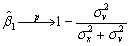 As a result you consider estimating the slope and intercept by TSLS.You think about an instrument and consider the temperature one month ahead of the observation in the previous year.Discuss instrument validity for this case.
(c)The TSLS estimation result is as follows:  = -6.24 + 1.07×
  ;
;
(0.06)
Perform a t-test on whether or not the slope is now significantly different from one.
Definitions:
Cash Operating Costs
The expenses directly associated with the day-to-day operations of a business, excluding non-cash items like depreciation.
Payback Period
The duration of time it takes for an investment to generate cash flows sufficient to recover its initial cost.
Discount Rate
The discount rate that's critical in the process of valuing future cash flows today, within the framework of discounted cash flow analysis.
Net Present Value
A financial metric used to evaluate the profitability of an investment, calculated by subtracting the present value of cash outflows from the present value of cash inflows.
Q6: In practice,the most difficult aspect of IV
Q10: Assume that you have 125 observations on
Q13: The accompanying table lists the height (STUDHGHT)in
Q25: The correlation coefficient<br>A)lies between zero and one.<br>B)is
Q27: We wish to see if the electronic
Q35: The height of male students at your
Q37: You have collected quarterly Canadian data on
Q39: The accompanying table shows the joint distribution
Q47: If the instruments are not exogenous,<br>A)you cannot
Q67: Suppose that <img src="https://d2lvgg3v3hfg70.cloudfront.net/TB5065/.jpg" alt="Suppose that