Parts manufactured by an injection molding process are subjected to a compressive strength test.We monitor the compressive strength of the parts manufactured by this process using an  and an s control chart.Samples of size 9 are taken at regular intervals,and their mean compressive strength (in psi = pounds per square inch) and standard deviation are plotted on the charts in time order.The overall mean of the sample means is
  = 81.2 psi,and the sample standard deviation of all measurements is s = 3.0 psi.Specifications call for the compressive strength of parts to be 80 ± 2.5 psi.The control chart constants are (partially) reproduced below.
 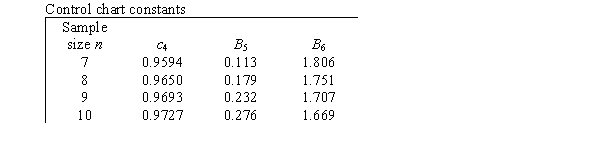 What is the value of an estimate of the capability index Cp?
Definitions:
Straight Line
In mathematics and statistics, a linear relationship or function that can be graphically represented as a straight line in Cartesian coordinates.
Correlation Coefficient
A statistical measure ranging from -1 to 1 that indicates the strength and direction of the linear relationship between two variables.
Scatterplot
A graphical representation of individual data points plotted on a two-dimensional plane, often used to observe and analyze the relationship between two variables.
Least Squares Regression Line
A straight line that best fits the data on a scatter plot, minimizing the sum of the squares of the vertical distances of the points from the line.
Q3: The square footage of the several thousand
Q11: The second letter of a word in
Q18: "Cramming" is a technique often used by
Q26: Suppose we are given the following information:
Q35: Researchers at a car resale company are
Q38: What is the major difference between a
Q45: The margin of error in a confidence
Q52: Multiple regression can be used for which
Q84: The moisture in a wet mix of
Q86: In a probability model,all possible outcomes together