Figure 9.7: The Output Gap 1980-2015 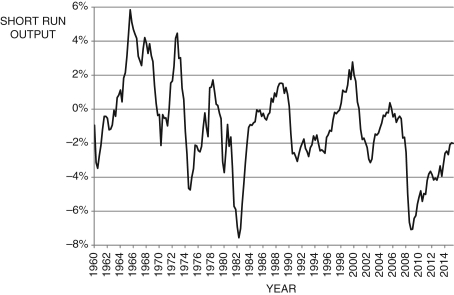 (Source: Federal Reserve Economic Data, St. Louis Federal Reserve)
-Figure 9.7 above shows the output gap for the years 1960-2015. Using the Phillips curve and Okun's law, discuss the impacts on inflation and unemployment for the years 1997-2000 and 2008-2015. From this analysis, what is the relationship between unemployment and inflation?
Definitions:
Benchmarking
A systematic approach to identifying the activities with the greatest room for improvement. It is based on comparing the performance in an organization with the performance of other, similar organizations known for their outstanding performance.
Business Process
A series of steps that are followed to carry out some task in a business.
Output Capacity
The maximum amount of goods or services a company can produce in a given period under normal working conditions.
Maximum Weekly Output
The highest quantity of goods or services that can be produced or delivered by a company or facility in a week, given resource and operational constraints.
Q33: In the 1960s, European unemployment rates were
Q54: Consider Figure 9.2. In approximately what years
Q68: In the Romer model, the Mexican economy:<br>A)
Q78: According to Ricardian equivalence, an increase in
Q79: Federal debt as a ratio to GDP
Q87: According to payscale.com, the average salary for
Q97: One problem with unexpected changes in inflation
Q101: Consider Figure 12.8. You are chairman of
Q105: The basic IS model embodies the life-cycle
Q105: Over the past 30 years, _ has