Multiple Choice
Refer to the following figure to answer the following questions.
Figure 7.1: U.S. Unemployment Rate: 1975-2015 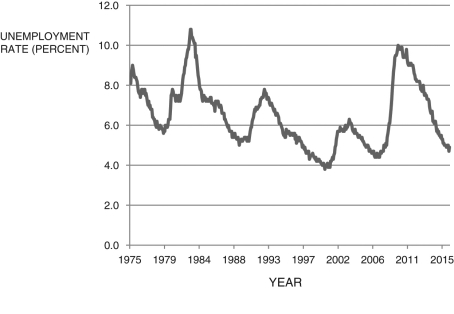 (Source: U.S. Bureau of Labor Statistics)
-Using Figure 7.1, Which of the following year(s) are the approximate trough of a recession?
Definitions:
Related Questions
Q21: In the equation <img src="https://d2lvgg3v3hfg70.cloudfront.net/TB6622/.jpg" alt="In the
Q35: Which of the following is an example
Q39: In the Solow model, investment, I<sub>t</sub>, as
Q43: The amount of raw material in the
Q43: The costs associated with changing prices are
Q51: The home price index of housing prices
Q74: Table 8.3 contains the following variables, growth
Q74: For which of the following does the
Q106: Using Figure 7.1, Which of the following
Q118: You are given the data in Table