Refer to the following figure when answering the following questions.
Figure 5.1: Solow Diagram 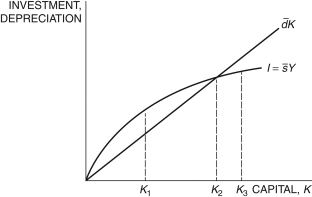
-In Figure 5.1, if the economy begins with the initial capital stock at K1, the capital stock will ________ and the economy will ________.
Definitions:
Centerline
In statistical process control charts, it represents the mean or average value of the process measurements over time, serving as a benchmark for detecting variations.
Lower Control Limit
In quality control, the lower threshold below which a process is considered out of control and corrective action may be necessary.
Defective Units
Items in a batch of products that fail to meet the required quality standards.
Type I Error
The inaccurate dismissal of a real null hypothesis, also labeled a "false positive."
Q14: The average unemployment benefit of an American
Q17: If you have data on per capita
Q71: The real interest rate is:<br>A) the interest
Q74: Table 8.3 contains the following variables, growth
Q79: Yale professor Ray Fair's presidential prediction model
Q84: If per capita GDP in 2014 was
Q91: In the "bathtub model" of unemployment, in
Q101: Suppose that rather than the Cobb-Douglas production
Q112: Government consumption as a share of GDP
Q127: The equation <img src="https://d2lvgg3v3hfg70.cloudfront.net/TB6622/.jpg" alt="The equation