Refer to the following table when answering the following questions.
Table 4.1: Production Model's Prediction for Per Capita GDP (US = 1) 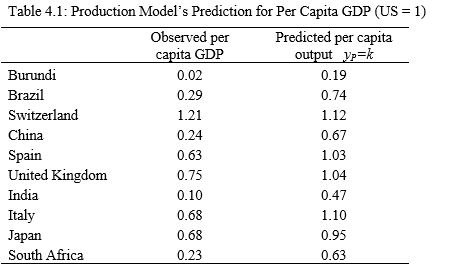 (Source: Penn World Tables 9.0)
-Considering the data in Table 4.1, the explanation for the difference between the predicted and actual level of output is called ________. If you compare India's observed and predicted output, this difference is equal to ________.
Definitions:
Dividend
A portion of a company's earnings distributed to shareholders, usually in the form of cash or additional shares.
Directors
Individuals elected by shareholders to manage a corporation's affairs and make key strategic decisions on their behalf.
Stock Dividends
These are dividends paid by a company to its shareholders in the form of additional shares of stock, rather than in cash.
Contributed Capital
Funds raised by a company through the issuance of shares to investors, representing the stockholders' equity apart from retained earnings.
Q9: A balanced growth path is defined as
Q18: The National Income and Product Accounts allows
Q30: In the corn farm example, corn can
Q68: Consider the three production functions in Figure
Q90: A production function of the form <img
Q92: In the Cobb-Douglas production function <img src="https://d2lvgg3v3hfg70.cloudfront.net/TB6622/.jpg"
Q103: Over the course of his or her
Q109: According to historical data, the wages in
Q115: Exogenous variables are predetermined by the model
Q124: Which of the following production functions exhibits