Below is a diagram representing a solvent A(l) in a 1-L beaker,and a solute X dissolved in the solvent.Solvent A has a density of 0.8 g/mL,and a molar mass of 40 g/mol. Solute X has a molar mass of 30 g/mol.Each circle of X represents 1 mol of X.Assume that the solute addition does not significantly change the volume of liquid in the beaker. 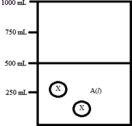 What is the molality of the solute X in this solution?
Definitions:
Total Profit
The total earnings of a business after subtracting all costs, including both fixed and variable costs, from total revenue.
Average Total Cost
The total cost of production divided by the total quantity produced, including both fixed and variable costs.
Average Variable Cost
The total variable costs (costs that change with the level of output) divided by the quantity of output produced.
Losing Money
The process where expenses exceed revenues, resulting in financial loss for a business or individual.
Q41: Dissolving a solute such as KOH in
Q59: Below is a diagram representing a solvent
Q69: At what temperature does ethanol boil on
Q71: What is the free energy change,ΔG°,for the
Q79: According to the VSEPR model,the predicted molecular
Q115: The standard free energy of formation of
Q121: Farmers who raise cotton once used arsenic
Q125: What is defined as the number of
Q125: Osmosis is the selective passage of solvent
Q140: The osmotic pressure of a 0.82 M