Table 7.8
King Supply makes four different types of plumbing fixtures: W,X,Y and Z.The contribution margins for these products are: $70 for Product W,$60 for Product X,$90 for Product Y and $100 for Product Z.Fixed overhead is estimated at $5,500 per week.The manufacture of each fixture requires four machines,Machines #1,2,3 and 4.Each of the machines is available for 40 hours a week and there is no setup time required when shifting from the production of one product to any other.The processing requirements to make one unit of each product are shown in the table.Weekly product demand for the next planning period has been forecasted as follows: 70 Ws,60 Xs,50 Ys and 30 Zs. 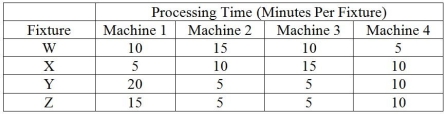 In the questions that follow,the traditional method refers to maximizing the contribution margin per unit for each product,and the bottleneck method refers to maximizing the contribution margin per minute at the bottleneck for each product.
-Use the information in Table 7.8.Using the bottleneck method,in what sequence should products be scheduled for production?
Definitions:
Synchronization
The process of making two or more things happen at the same time and speed.
Team Interaction
The process of team members exchanging information, ideas, and feedback through various forms of communication, which influences team dynamics and performance.
TMS
stands for Transcranial Magnetic Stimulation, a noninvasive procedure that uses magnetic fields to stimulate nerve cells in the brain.
Team Training
It is a structured program designed to enhance team performance and coherence through teaching collective skills, communication, and problem-solving strategies.
Q2: The standard assumption in the single-server model
Q22: Use the information in Scenario B.4.What is
Q40: A capacity decision in a call center,such
Q58: A larger capacity cushion can help firms
Q72: In a lean system,wait times can be
Q99: The four bolts that hold the passenger
Q110: _-demand items are items for which demand
Q137: What are the supply chain implications of
Q138: The central line on a p-chart is
Q206: Using Table 5.2,for the R-chart,what is the