Table 5.11
Factors for Calculating Three-Sigma Limits for the  Chart and R-Chart
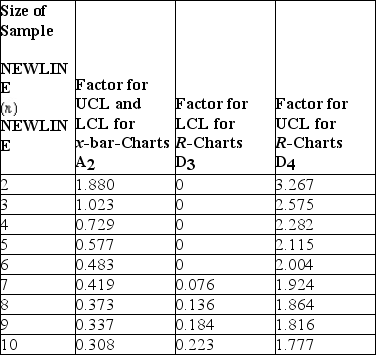 Source: 1950 ASTM Manual on Quality Control of Materials,copyright American Society for Testing Materials.Reprinted with permission.
-Thermostats are subjected to rigorous testing before they are shipped to air conditioning technicians around the world.Results from the last five samples are shown in the table.Calculate control limits for a chart that will monitor performance to target.The correct control limits as (LCL,UCL) are: 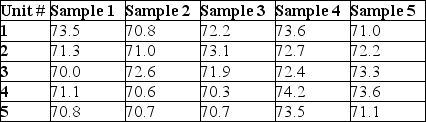
Definitions:
Managing Conflict
The process of identifying and addressing differences that, if left unchecked, could affect project performance.
Forming Stage
The initial phase of team development where members are brought together, get to know each other, and start to understand the team's goals.
Team Development
The process of enhancing the effectiveness of work groups through improving goal setting, roles, interpersonal relationships, and problem-solving strategies.
Storming Stage
The phase in group development where members experience conflicts and competition, as individual personalities and differences emerge.
Q34: Use the information in Case 6.2.How many
Q36: A work sampling method is used to
Q51: The three person crew worked their way
Q58: Use the information provided in Table 1.1.An
Q64: Comment on the need for flexibility in
Q83: Budgeting,recruiting,and scheduling are examples of a(n):<br>A)development.<br>B)core process.<br>C)support
Q85: What are the four underlying principles of
Q146: Explain why a sampling schedule is important
Q158: When a process fails to satisfy a
Q228: Compare and contrast the method of time