Figure Q10-7 shows data from one of the first experiments demonstrating LTP by Bliss and Lomo (1973). The arrows indicate points at which high frequency stimuli were given. 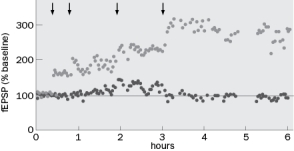 Figure
A. Figure Q10-7A below depicts an example of a field EPSP prior to high frequency stimulation. The vertical line is the stimulus artifact. What would the fEPSP look like at 1 hour and 4 hours? 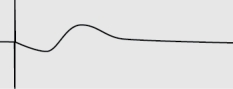 Figure Q10-7A
B. What would happen to the response if Bliss and Lomo had given a low frequency stimulation of about 1 Hz at 5 hours?
Question 10-8 and 10-9 refer to (Figure Q10-8) below. Figure Q10-8 shows a synaptic matrix, which describes how changes in synaptic weight can contribute to memory storage. There are presynaptic inputs A-E and postsynaptic outputs I-IV. 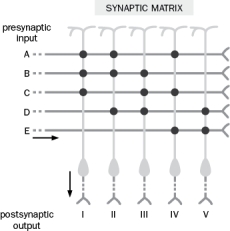 Figure
Definitions:
WiFi Analyzer
A software tool used to scan wireless networks in the vicinity, analyzing and providing information on their signal strength, security, and channel usage.
Wireless Network
A telecommunications network that enables devices to connect and communicate wirelessly over radio waves without the need for a physical connection.
Wireless Standards
Protocols established to ensure interoperability and compatibility among wireless devices, such as Wi-Fi (IEEE 802.11) and Bluetooth standards.
802.11n
An IEEE wireless standard that uses both the 2.4 and 5 GHz ranges and that supports speeds up to 600 Mb/s.
Q11: Overexpressing a single isoform of Dscam in
Q13: Fill in each of the blanks with
Q23: Which one of the following performance measures
Q27: The overrepresentation of sound frequencies between 60
Q34: Self-directed teams may mean having no supervision
Q35: How might ergonomics be used to help
Q35: Besides rods and cones, what is the
Q38: Dopamine neurons in the VTA synapse onto
Q47: Syt1 point mutation is a point mutation
Q146: It is said that job expansion has