Examlex

Solved

TABLE 17-10 Given Below Are Results from the Regression Analysis Where the Where

question 200

True/False

TABLE 17-10
Given below are results from the regression analysis where the dependent variable is the number of weeks a worker is unemployed due to a layoff (Unemploy)and the independent variables are the age of the worker (Age),the number of years of education received (Edu),the number of years at the previous job (Job Yr),a dummy variable for marital status (Married: 1 = married,0 = otherwise),a dummy variable for head of household (Head: 1 = yes,0 = no)and a dummy variable for management position (Manager: 1 = yes,0 = no).We shall call this Model 1.The coefficient of partial determination ( TABLE 17-10 Given below are results from the regression analysis where the dependent variable is the number of weeks a worker is unemployed due to a layoff (Unemploy)and the independent variables are the age of the worker (Age),the number of years of education received (Edu),the number of years at the previous job (Job Yr),a dummy variable for marital status (Married: 1 = married,0 = otherwise),a dummy variable for head of household (Head: 1 = yes,0 = no)and a dummy variable for management position (Manager: 1 = yes,0 = no).We shall call this Model 1.The coefficient of partial determination (   )of each of the 6 predictors are,respectively,0.2807,0.0386,0.0317,0.0141,0.0958,and 0.1201.   Model 2 is the regression analysis where the dependent variable is Unemploy and the independent variables are Age and Manager.The results of the regression analysis are given below:   -True or False: Referring to Table 17-10,Model 1,the null hypothesis should be rejected at a 10% level of significance when testing whether there is a significant relationship between the number of weeks a worker is unemployed due to a layoff and the entire set of explanatory variables. )of each of the 6 predictors are,respectively,0.2807,0.0386,0.0317,0.0141,0.0958,and 0.1201. TABLE 17-10 Given below are results from the regression analysis where the dependent variable is the number of weeks a worker is unemployed due to a layoff (Unemploy)and the independent variables are the age of the worker (Age),the number of years of education received (Edu),the number of years at the previous job (Job Yr),a dummy variable for marital status (Married: 1 = married,0 = otherwise),a dummy variable for head of household (Head: 1 = yes,0 = no)and a dummy variable for management position (Manager: 1 = yes,0 = no).We shall call this Model 1.The coefficient of partial determination (   )of each of the 6 predictors are,respectively,0.2807,0.0386,0.0317,0.0141,0.0958,and 0.1201.   Model 2 is the regression analysis where the dependent variable is Unemploy and the independent variables are Age and Manager.The results of the regression analysis are given below:   -True or False: Referring to Table 17-10,Model 1,the null hypothesis should be rejected at a 10% level of significance when testing whether there is a significant relationship between the number of weeks a worker is unemployed due to a layoff and the entire set of explanatory variables. Model 2 is the regression analysis where the dependent variable is Unemploy and the independent variables are Age and Manager.The results of the regression analysis are given below: TABLE 17-10 Given below are results from the regression analysis where the dependent variable is the number of weeks a worker is unemployed due to a layoff (Unemploy)and the independent variables are the age of the worker (Age),the number of years of education received (Edu),the number of years at the previous job (Job Yr),a dummy variable for marital status (Married: 1 = married,0 = otherwise),a dummy variable for head of household (Head: 1 = yes,0 = no)and a dummy variable for management position (Manager: 1 = yes,0 = no).We shall call this Model 1.The coefficient of partial determination (   )of each of the 6 predictors are,respectively,0.2807,0.0386,0.0317,0.0141,0.0958,and 0.1201.   Model 2 is the regression analysis where the dependent variable is Unemploy and the independent variables are Age and Manager.The results of the regression analysis are given below:   -True or False: Referring to Table 17-10,Model 1,the null hypothesis should be rejected at a 10% level of significance when testing whether there is a significant relationship between the number of weeks a worker is unemployed due to a layoff and the entire set of explanatory variables.
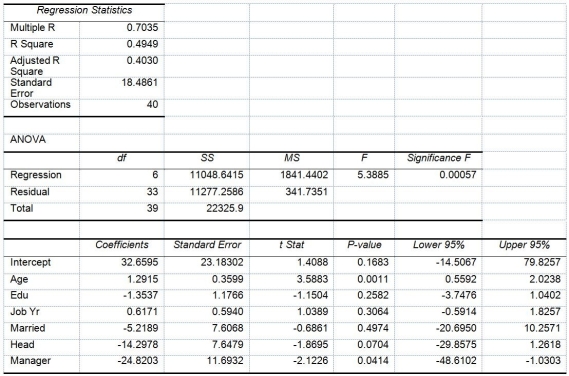
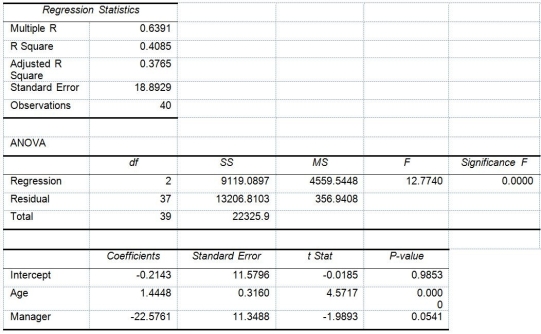
-True or False: Referring to Table 17-10,Model 1,the null hypothesis should be rejected at a 10% level of significance when testing whether there is a significant relationship between the number of weeks a worker is unemployed due to a layoff and the entire set of explanatory variables.

Implement problem-oriented assessment approaches effectively.
Utilize appropriate interviewing techniques considering cultural sensitivities and patient's conditions.
Assess patient's pain using the PQRST method accurately.
Understand and apply methods for collecting patient data.

Definitions:

Process Costing

Process costing is a method of costing used by companies that produce similar or homogenous products, where costs are accumulated over a period and then allocated to units of product.

Weighted-Average Method

An inventory costing method that assigns an average cost to each unit of inventory, calculated by dividing the total cost of goods available for sale by the total units available.

Conversion Cost

Sum of direct labor and manufacturing overhead costs, representing the costs necessary to convert raw materials into finished goods.

Process Costing

An accounting methodology used to assign costs to units of production in industries where the production process is continuous.

Related Questions