TABLE 14-15
The superintendent of a school district wanted to predict the percentage of students passing a sixth-grade proficiency test.She obtained the data on percentage of students passing the proficiency test (% Passing),mean teacher salary in thousands of dollars (Salaries),and instructional spending per pupil in thousands of dollars (Spending)of 47 schools in the state.
Following is the multiple regression output with Y = % Passing as the dependent variable,X1 = Salaries and X2 = Spending: 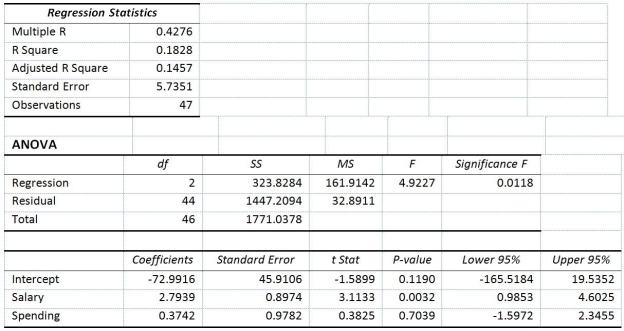
-True or False: Referring to Table 14-15,you can conclude definitively that mean teacher salary individually has no impact on the mean percentage of students passing the proficiency test,taking into account the effect of instructional spending per pupil,at a 1% level of significance based solely on but not actually computing the 99% confidence interval estimate for β1.
Definitions:
Mode
The value that occurs most frequently in a given data set.
Median Hours
The middle value of the total hours studied or worked, sorted in ascending or descending order.
Sample Mean Hours
The average number of hours calculated from a sample, used to estimate the mean hours of a population.
Stem And Leaf Display
A graphical method of displaying quantitative data to show its distribution, using stems and leaves to group data points.
Q22: Referring to Table 14-13,the fitted model for
Q30: Referring to Table 16-12,the best interpretation of
Q48: Referring to Table 13-10,what is the value
Q48: Referring to Table 12-7,the critical value of
Q71: Referring to Table 13-3,the director of cooperative
Q75: Referring to Table 15-4,which of the following
Q88: True or False: Referring to Table 15-6,the
Q203: Referring to Table 13-9,to test the claim
Q239: Referring to Table 14-11,which of the following
Q243: Referring to Table 14-16,_ of the variation