TABLE 13-12
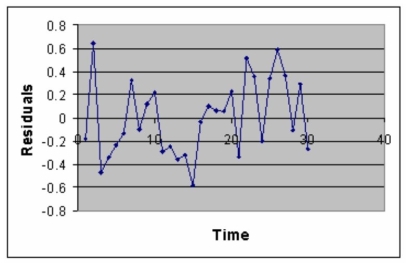
The manager of the purchasing department of a large banking organization would like to develop a model to predict the amount of time (measured in hours) it takes to process invoices. Data are collected from a sample of 30 days, and the number of invoices processed and completion time in hours is recorded. Below is the regression output:
 Note: 4.3946E-15 is 4.3946×10⁻¹⁵
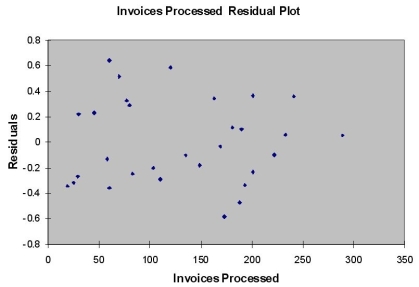
-Referring to Table 13-12, the value of the measured t-test statistic to test whether the amount of time depends linearly on the number of invoices processed is
Definitions:
Q15: Referring to Table 12-17, there is sufficient
Q22: Referring to Table 15-5, what is the
Q28: Referring to Table 11-1, at the 0.01
Q31: Referring to Table 13-3, the regression sum
Q53: Referring to Table 10-4, what is the
Q81: Referring to Table 14-1, for these data,
Q85: Referring to Table 10-8, the null hypothesis
Q105: Referring to Table 13-5, the coefficient of
Q115: Referring to Table 13-12, the degrees of
Q203: When an explanatory variable is dropped from