Multiple Choice
The diagram below shows selected cost and revenue curves for a firm in a monopolistically competitive industry. 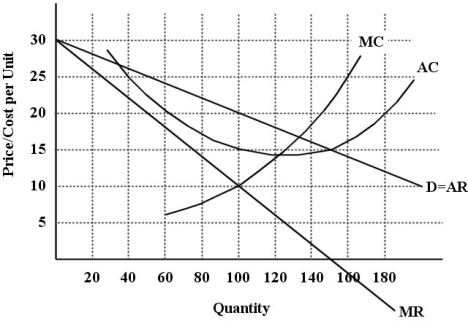 FIGURE 11- 1
-Refer to Figure 11- 1. What price will this profit- maximizing firm set?
Definitions:
Related Questions
Q2: A marketing plan should never identify small
Q11: "Who do we want to become?" is
Q19: Which strategy in the Ansoff Product-Market Growth
Q26: By calculating a concentration ratio, economists measure
Q32: In a SWOT analysis, strengths are defined
Q38: Bob is writing a marketing plan and
Q40: Explain the Treacy and Wiersema strategies.
Q40: The "informal defence" of free markets includes
Q67: Assume that the market for farmland in
Q75: Consider the perfectly competitive labour market for