 Figure 13-7B
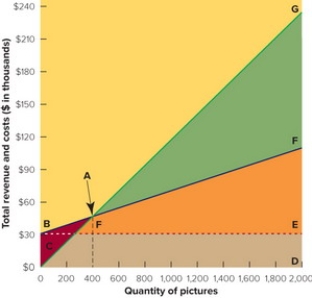
-In the break-even chart in Figure 13-7 above, the rectangular area EBCD represents the firm's
Definitions:
Net Income
The net income of a company, which is calculated by deducting all costs and taxes from its total earnings.
Break-Even Point
The production level or sales volume at which total revenues equal total expenses, resulting in no net loss or gain.
Contribution Margin Ratio
A financial metric that represents the percentage of sale price that remains after variable costs are subtracted.
Sales Dollars
The total amount of money generated from the sale of goods or services before any expenses are subtracted.
Q30: Suppose you are the owner of a
Q120: The primary purpose of a trademark is
Q126: All of the following are responsibilities of
Q144: Tim Marlow, the owner of The Clock
Q180: Managing for long-run profits as a pricing
Q205: Amanda needs to have her car repaired.
Q211: All of the following marketing actions can
Q234: Bob Biltmore owns dozens of very successful
Q240: The pricing approach that results in the
Q243: A single jar of original formula Carmex