 Figure 13-7B
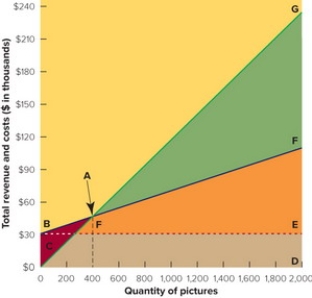
-In the break-even chart in Figure 13-7 above, the triangular area FBE represents the firm's
Definitions:
Standard Cost Card
A detailed listing of the standard amounts of inputs and their costs that are required to produce one unit of a specific product.
Standard Variable Cost
The budgeted, per-unit cost of variable elements of production, such as materials and labor, under normal operating conditions.
Direct Materials
The cost of raw materials that can be directly traced to the production process.
Materials Price Variance
The difference between the actual cost of materials used in production and the expected standard cost, which can indicate changes in material costs over time.
Q73: Figure 13-7 above depicts a<br>A) Gantt chart.<br>B)
Q78: Capacity management refers to<br>A) integrating the service
Q81: A person can establish expectations for a
Q114: Price lining is considered to be a
Q116: Which of these is one of the
Q136: Cost-plus-percentage-of-cost pricing refers to<br>A) summing the total
Q142: Factors that limit the range of prices
Q182: Give an example of yield management pricing
Q193: Your local instant photocopying service charges 10
Q247: Which of the four approaches does Carmex