Exhibit 11.12
The following questions use the data below.
Joe's Sporting Goods wants to forecast quarterly sales figures using a seasonal regression model. The store has collected 12 quarters of data and needs your help to analyze the data. The relevant regression output is provided in the following table. 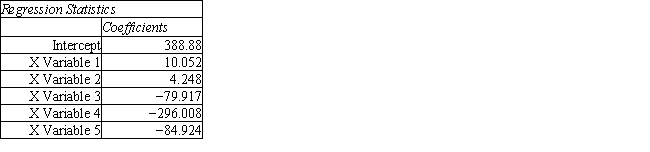
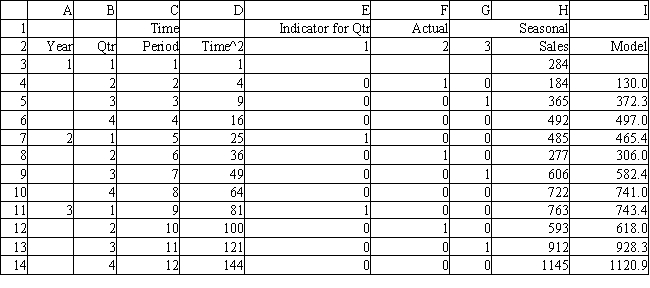
-Refer to Exhibit 11.12. What formula should be entered in cell I3 to compute the Seasonal Value for year 1 Quarter 1?
Definitions:
Significance Level
The probability threshold below which the null hypothesis is rejected in a statistical test, indicating the results are statistically significant.
Chi-squared Goodness-of-fit Test
A statistical test to determine if observed data matches the expected distribution of data across different categories.
Chi-squared Distribution
A statistical distribution describing the distribution of the sum of squared independent, standard normal variables, often used in hypothesis testing.
Non-negative
A term used to describe numbers that are either positive or zero, indicating values that are not less than zero.
Q12: Service capacity decisions have all but one
Q15: Refer to Exhibit 9.2. Interpret the meaning
Q20: Use slack variables to rewrite this
Q30: Refer to Exhibit 7.1. Which of the
Q37: When crashing activities for construction projects, the
Q45: In the long run, if service capacity
Q48: Refer to Exhibit 7.1. What formula goes
Q57: Refer to Exhibit 9.1. Interpret the meaning
Q58: Refer to Exhibit 8.2. What formula would
Q67: Project 13.1 <font face="symbol"></font> Internet Sales, Inc.<br>Internet