The owner of a bakery wants to analyze the relationship between the expenditure of a customer and the customer's income. A sample of 5 customers is taken and the following information was obtained. 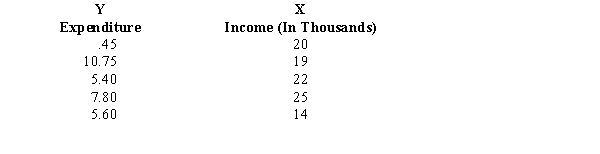 The least squares estimated line is
  = 4.348 + 0.0826 X.
a.Obtain a measure of how well the estimated regression line fits the data.
b.You want to test to see if there is a significant relationship between expenditure and income at the 5% level of significance. Be sure to state the null and alternative hypotheses.
c.Construct a 95% confidence interval estimate for the average expenditure for all customers with an income of $20,000.
d.Construct a 95% confidence interval estimate for the expenditure of one customer whose income is $20,000.
Definitions:
Inflation Rate
How fast prices for goods and services overall go up, causing the value of money to go down.
Real Price
The price of a good or service after adjusting for inflation, reflecting the true purchasing power.
CPI
Consumer Price Index, a measure that examines the weighted average of prices of a basket of consumer goods and services, such as transportation, food, and medical care.
Structural Steel Beams
Steel shapes used in construction that are designed to bear heavy loads and form the skeleton of buildings and bridges.
Q8: A factorial experiment involving 2 levels
Q11: Refer to Exhibit 15-8. The test statistic
Q28: Refer to Exhibit 15-6. The sum of
Q32: A regression model involved 5 independent variables
Q41: Temperature is an example of a variable
Q56: In the hypothesis testing procedure,
Q83: The office of records at a
Q90: Refer to Exhibit 14-10. The point estimate
Q105: Shown below is a portion of
Q129: Refer to Exhibit 14-8. The mean square