In order to attribute changes in nest activity to the active influence of the queen, 9 nests were randomly selected for experimental treatment. The normal activity of the nests were measured, and treatments were administered as described below:
Queens and Workers: Experimental Treatments
Normal treatment:
The observations were made of the undisturbed state of the nest as originally located.
Queen removed:
The queen was removed from the nest for about an hour.
Queen cooled/inactive:
The queen was removed to a cool environment, making her inactive, and returned to the nest; thus, she is present in the nest, but not able to interact with the worker wasps.
The data for the control treatment and each of the experimental treatments is given in the table below. The Activity Levels are the average proportion of active nest time for workers who were present in the normal and two experimental treatment periods. For example, 0.50 would mean for that nest the average amount of time the workers were actively working was 0.50 of the available time during that treatment. (The colony numbers are for identification in the table only.) 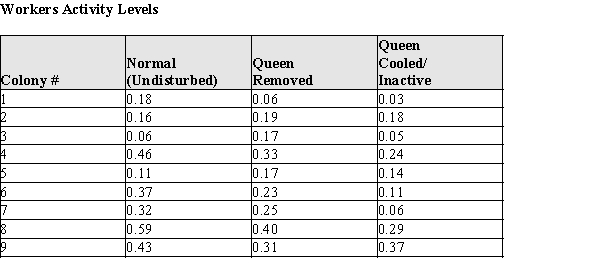
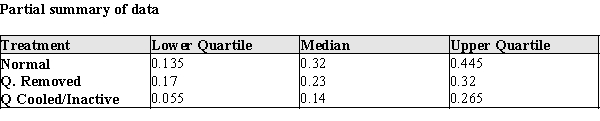
(a)Construct comparative box plots of the active nest times for (a) normal, (b) Queen removed, and (c) Queen Cooled/Inactive. (Note: since the data are proportions, there are no actual units for the data.)(b)Two current theories about the queen's interaction with workers are that (A) the queen increases worker activity by her mere presence, or (B) she increases worker activity by interacting with worker bees. Based on your plot in part (a), which theory--if either--is supported by the data? Justify your conclusion with an appropriate statistical argument.
(c)What are the mean and standard deviation of the proportion of worker activity for undisturbed wasp nests.  =
=
s =
(d)One of the nests (Colony #4) has a proportion of worker activity of 0.46. How many standard deviations above/below the mean is the worker activity level in this nest?
Definitions:
Q1: An article describes the results of an
Q6: In recent years there has been a
Q7: When testing hypotheses about and constructing confidence
Q15: Suppose that the actual proportion of people
Q20: Of the following, which is true of
Q22: A random sample will be selected from
Q29: Professor wants to identify the relationship between
Q33: Which of the five boxplots shown in
Q34: In a random sample of 79 students
Q119: Campbell has introduced a line of low-sodium