SCENARIO 14-15
The superintendent of a school district wanted to predict the percentage of students passing a sixth-
grade proficiency test. She obtained the data on percentage of students passing the proficiency test
(% Passing), mean teacher salary in thousands of dollars (Salaries), and instructional spending per
pupil in thousands of dollars (Spending) of 47 schools in the state. Following is the multiple regression output with Passing as the dependent variable,
Salaries and Spending:
ANOVA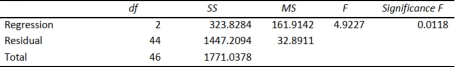
-Referring to Scenario 14-15, the null hypothesis implies that percentage of
students passing the proficiency test is not related to either of the explanatory variables.
Definitions:
Internal Rate of Return (IRR)
The discount rate at which the net present value of all cash flows (positive and negative) from a project or investment equals zero.
Weighted Average Cost of Capital (WACC)
WACC represents the average rate that a company is expected to pay to finance its assets, weighted by the proportion of debt and equity financing.
Terminal Value (TV)
Value of operations at the end of the explicit forecast period; it is equal to the present value of all free cash flows beyond the forecast period, discounted back to the end of the forecast period at the weighted average cost of capital.
Payback Period
The duration of time it takes for an investment to recoup its initial cost, often used to assess the risk or profitability of a project.
Q26: Referring to Scenario 15-7-B, the value of
Q99: Referring to Scenario 16-15-B, what is the
Q138: Referring to Scenario 14-4, _% of the
Q177: The coefficient of determination (r2) tells you<br>A)
Q178: Referring to Scenario 13-10, which is
Q212: Referring to Scenario 14-4, at the 0.01
Q221: Referring to Scenario 14-7, the department
Q227: Referring to Scenario 14-5, what is the
Q331: Referring to Scenario 14-4, one individual in
Q386: Referring to Scenario 14-5, what is the