SCENARIO 2-15
The figure below is the ogive for the amount of fat (in grams) for a sample of 36 pizza products
where the upper boundaries of the intervals are: 5, 10, 15, 20, 25, and 30. 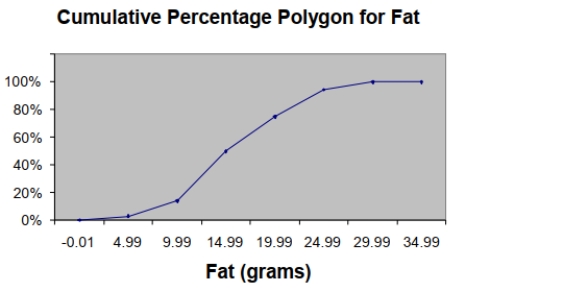
-Referring to Scenario 2-15, what percentage of pizza products contains between 10 and 25
Grams of fat?
Definitions:
Northern Colonial Ports
Ports in the Northern American colonies, which were essential for trade and the economy during the colonial period, serving as hubs for importing goods and exporting resources like timber and fish.
Rice Plantations
Large agricultural estates typically found in the southern United States where rice is grown as the main crop, historically reliant on the labor of enslaved Africans.
Birthrate of Slaves
The rate at which enslaved individuals gave birth, an indicator of population changes among enslaved communities.
Middle Passage
The sea voyage that transported enslaved Africans across the Atlantic Ocean to the Americas, a central part of the transatlantic slave trade known for its brutal conditions.
Q20: Referring to Scenario 2-7, if a frequency
Q34: In a perfectly symmetrical distribution<br>A) the range
Q63: Referring to Scenario 3-2, is the carbohydrate
Q66: Referring to Scenario 5-1, if your investment
Q67: A financial analyst is presented with information
Q112: Referring to Scenario 2-12, of those neutral
Q138: The Dean of Students conducted a survey
Q172: Referring to Scenario 2-1, how many drivers
Q177: Referring to Scenario 2-13, if a relative
Q181: The addition of visual elements that either