Essay
Use the following information for following questions .
The following scatterplot shows the relationship between heights (in cm) and weights (in kg) of 100
Americans. The coefficient of determination was found to be 37.9%. 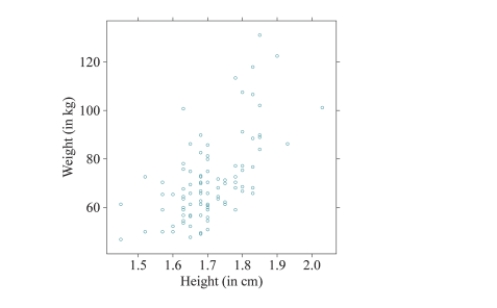
-Calculate the value of the correlation coefficient between height and weight.
Definitions:
Related Questions
Q3: The normal distribution below reflects a data
Q7: From the TI-84 graphing calculator screenshots below,
Q9: Explain why we can or cannot generalize
Q35: [Objective: Test a hypothesis for a population
Q35: Suppose we have a data set of
Q45: Find the exact value of
Q46: Which of the following is a true
Q51: [Objective: Test a hypothesis for a population
Q78: Determine the zeros (if any) of
Q109: Find <span class="ql-formula" data-value="f \circ