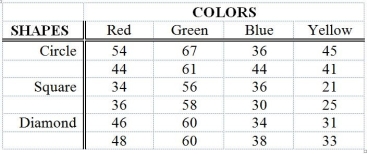
TABLE 11-12
The marketing manager of a company producing a new cereal aimed for children wants to examine the effect of the color and shape of the box's logo on the approval rating of the cereal. He combined 4 colors and 3 shapes to produce a total of 12 designs. Each logo was presented to 2 different groups (a total of 24 groups) and the approval rating for each was recorded and is shown below. The manager analyzed these data using the α = 0.05 level of significance for all inferences.

Analysis of Variance
Source df SS MS F p
Colors 3 2711.17 903.72 72.30 0.000
Shapes 2 579.00 289.50 23.16 0.000
Interaction 6 150.33 25.06 2.00 0.144
Error 12 150.00 12.50
Total 23 3590.50
-Referring to Table 11-12, the critical value in the test for significant differences between shapes is ________.
Definitions:
Classical Region
In economic theory, a phase where the supply of labor is abundant and the wage rates are therefore determined by the cost of living, not by the demand for labor.
Aggregate Supply Curve
An economic curve illustrating the overall supply of goods and services by all businesses and the government at various overall price levels in a given period.
Maximum Output Level
refers to the highest amount of production a company can achieve with the current resources and technology.
Production Possibilities Frontier
A curve representing a hypothetical model of a two-product economy operating at full employment.
Q2: Referring to Table 12-5, there is sufficient
Q22: Referring to Table 9-2, what would be
Q61: Referring to Table 14-5, what is the
Q96: If the Durbin-Watson statistic has a value
Q99: Referring to Table 9-7, the company officials
Q129: Referring to Table 13-3, the director of
Q131: Referring to Table 12-5, what is the
Q171: Referring to Table 13-4, the prediction for
Q187: Referring to Table 12-7, the expected cell
Q188: Referring to Table 13-9, the estimated change