TABLE 15-6
Given below are results from the regression analysis on 40 observations where the dependent variable is the number of weeks a worker is unemployed due to a layoff (Y) and the independent variables are the age of the worker (X₁), the number of years of education received (X₂), the number of years at the previous job (X₃), a dummy variable for marital status (X₄: 1 = married, 0 = otherwise), a dummy variable for head of household (X₅: 1 = yes, 0 = no) and a dummy variable for management position (X₆: 1 = yes, 0 = no).
The coefficient of multiple determination (R) for the regression model using each of the 6 variables Xⱼ as the dependent variable and all other X variables as independent variables are, respectively, 0.2628, 0.1240, 0.2404, 0.3510, 0.3342 and 0.0993.
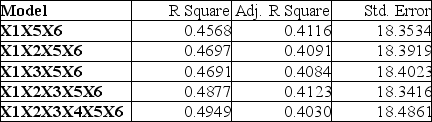
The partial results from best-subset regression are given below:
-Referring to Table 15-6, there is reason to suspect collinearity between some pairs of predictors based on the values of the variance inflationary factor.
Definitions:
Q-Sort
A method used in psychology to assess individuals' viewpoints or personality traits through the sorting of statements.
Therapy
The treatment of mental, emotional, or behavioral disorders through psychological methods.
Self-Concept Change
The process of transformation or modification in one's perception of oneself, including aspects like identity, qualities, and capabilities.
Person-Centered Therapy
A psychotherapeutic approach that emphasizes the importance of being led by the client, focusing on their individual perception of self-concept in a non-directive and accepting atmosphere.
Q9: Which of the following statements about moving
Q18: Referring to Table 15-1, what is the
Q21: Referring to Table 8-1, if the population
Q30: Referring to Table 15-6, there is reason
Q43: Referring to Table 16-13, you can conclude
Q89: An independent variable Xⱼ is considered highly
Q95: Referring to Table 13-13, if the state
Q115: Referring to Table 13-12, there is sufficient
Q208: Referring to Table 13-10, what are the
Q210: Referring to Table 13-13, the value of