TABLE 15-6
Given below are results from the regression analysis on 40 observations where the dependent variable is the number of weeks a worker is unemployed due to a layoff (Y) and the independent variables are the age of the worker (X₁), the number of years of education received (X₂), the number of years at the previous job (X₃), a dummy variable for marital status (X₄: 1 = married, 0 = otherwise), a dummy variable for head of household (X₅: 1 = yes, 0 = no) and a dummy variable for management position (X₆: 1 = yes, 0 = no).
The coefficient of multiple determination (R) for the regression model using each of the 6 variables Xⱼ as the dependent variable and all other X variables as independent variables are, respectively, 0.2628, 0.1240, 0.2404, 0.3510, 0.3342 and 0.0993.
The partial results from best-subset regression are given below:
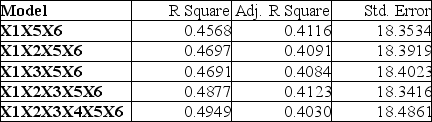
-Referring to Table 15-6, the model that includes X₁, X₂, X₃, X₅ and X₆ should be selected using the adjusted r² statistic.
Definitions:
Deviation
Difference between expected payoff and actual payoff.
Expected Value
The weighted average of all possible values of a random variable, with the weights being the probabilities of each outcome.
Absolute Value
The distance of a number from zero on the number line, disregarding its sign.
Payoff
The outcome or return from an investment or decision, often expressed in terms of profit or loss.
Q5: Referring to Table 16-12, the best interpretation
Q27: Referring to Table 16-8, the forecast for
Q54: Referring to Table 16-10, the residuals for
Q56: Referring to Table 17-3, suppose the analyst
Q97: The effect of an unpredictable, rare event
Q119: Referring to Table 13-12, the model appears
Q201: Referring to 14-16, which of the following
Q237: Referring to Table 7-2, the mean of
Q281: Referring to Table 14-17 and using both
Q310: Referring to Table 9-2, if you select