TABLE 16-13
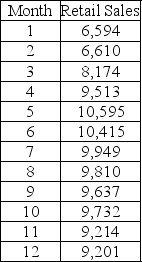
Given below is the monthly time-series data for U.S. retail sales of building materials over a specific year.

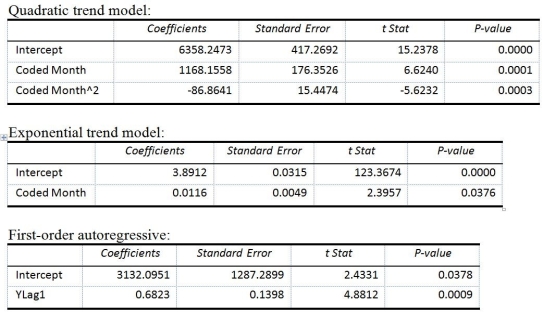
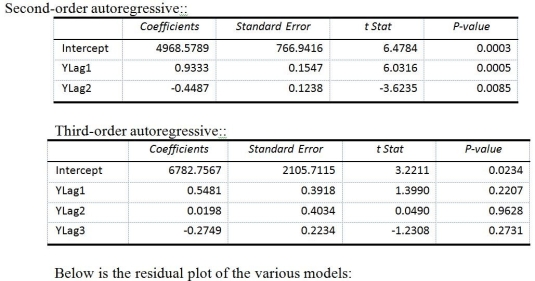
The results of the linear trend, quadratic trend, exponential trend, first-order autoregressive, second-order autoregressive and third-order autoregressive model are presented below in which the coded month for the first month is 0:


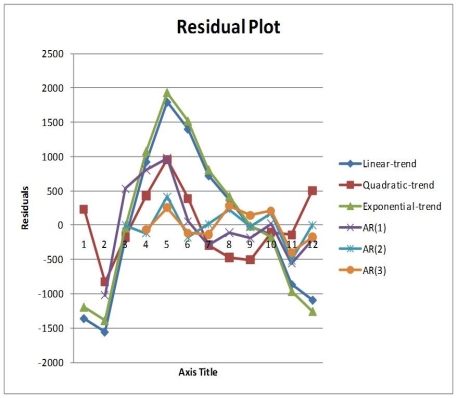
-Referring to Table 16-13, the best model based on the residual plots is the exponential-trend regression model.
Definitions:
Q19: Referring to Table 16-13, if a five-month
Q28: Referring to Table 15-6, what is the
Q32: Referring to Table 17-9, an R chart
Q50: Referring to Table 19-5, what is the
Q84: Referring to Table 17-8, an <br> <img
Q86: Referring to Table 16-3, suppose the last
Q254: Referring to Table 9-3, if you select
Q269: Referring to 14-16, what is the correct
Q274: Referring to Table 14-19, which of the
Q317: Referring to Table 14-15, you can conclude