The graph shown displays the Lorenz curve for a society. 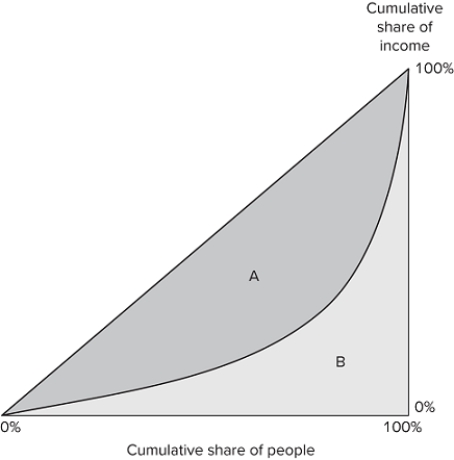 If area A is equal to 3,100 and area B is equal to 1,900, what is the Gini coefficient?
Definitions:
Censoring
The suppression or prohibition of any parts of books, films, news, etc. that are considered obscene, politically unacceptable, or a threat to security.
Relevant Information
Data or facts closely related to the subject at hand or of importance to the decision-making process.
Actor-Observer Effect
A tendency to attribute one's own actions to external causes while attributing other people's behaviors to their internal characteristics.
Bystander Effect
A psychological social effect where people are less inclined to assist someone in distress if there are others around.
Q16: The practice of making choices using generalizations
Q26: Suppose the government designs a program that
Q26: An important category of bias in human
Q60: The _ theorem suggests that politicians maximize
Q74: Tom and Jerry have one day to
Q78: If the punishment associated with breaking a
Q91: The _ bowed inward the Lorenz curve
Q100: Suppose that out of the two cities
Q114: When does a surplus occur?<br>A)When the quantity
Q137: <img src="https://d2lvgg3v3hfg70.cloudfront.net/TB8422/.jpg" alt=" Refer to the